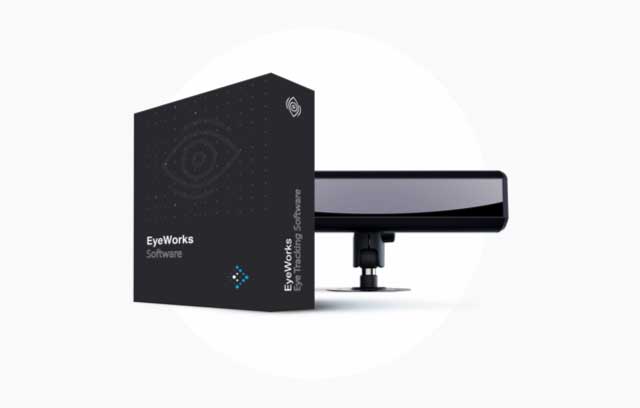
There’s a lot to like about EyeWorks™. Its unique brand of flexible efficacy makes it an ideal software solution for eye tracking professionals in a variety of academic, applied and marketing fields. To put it simply, EyeWorks™ IS the collective expertise of EyeTracking, Inc., refined and packaged for researchers everywhere. In the coming months we will highlight a few unique features of EyeWorks™ in the EyeTracking Blog.
Dynamic Region Analysis (Patent Pending)
All good science must quantify results. Eye tracking research is no exception, be it academic, applied, marketing or any other discipline. Unless you have an objective way to evaluate the precise activity of the eye, there is little value in collecting such data. Thus, most eye tracking software offers the ability to draw regions (or AOIs, if you like) as a way to quantify the number and timing of data points within any static area. In other words, if you want to know how long the user of your training software spends viewing the dashboard, or when your website user sees the navigation, or how many eyes run across your magazine ad, you can simply draw the shape and let the software generate the results. This is quite useful, but there’s a limitation (hint: it’s underlined and bolded above). Yes, the operative word is static. Most eye tracking analysis software allows you to draw regions for static content only. That means no flash, no dropdowns, no mobile features of a simulation, no video, no objects moving in a scene camera view. As you can imagine, this seriously inhibits the ability of the researcher to quantify the results of any study of dynamic content.
…Unless that researcher is using EyeWorks, a software platform that does not limit regions to the static variety. Dynamic Region Analysis allows you to build regions that change shape, regions that move closer and farther away, regions that disappear and reappear. Generally speaking, any region that is visible at any time during your testing session can be tracked. This patent-pending feature has been part of EyeWorks for the past five years, and we’ve used it in analysis of video games, websites, television, simulators, advertisements, package design and sponsorship research. Because of EyeWorks, the results of these dynamic content studies include more than just approximations of viewing behavior and subjective counting of visual hits; they include detailed statistical analysis of precise eye activity. Our clients appreciate this distinction.
Here’s a video in case you are having trouble visualizing (so to speak) dynamic regions. We’ve taken a very subtle product placement scene from a film, and used EyeWorks’ Dynamic Region Analysis to identify the hidden advertising (outlined in green). In a study of this content, these regions would allow us to analyze precisely (1) when each product was seen, (2) how many viewers saw it and (3) how long they spend looking it. Click the embedded clip below and watch the dynamic regions in action.
This is yet another example of an area where other eye tracking software says “No Way,” and EyeWorks says “Way!” Contact our sales team if you are interested in learning more about EyeWorks or any of our other products and services.


